Impact Report 2023-2025
Community at a Glance
In 2025, our community grew to 2,450 members across the UK, with Black and Global Majority-led organisations at the heart of everything we do. From £2.65 million in grants disbursed to leadership confidence nearly doubling, see the data behind our growing impact.
Our Community in Numbers
As of December 2025, the Do it Now Now community comprised a robust collective of 2,450 individuals.
2,450 Total Registered Members (UK-wide social changemakers)
Economic Profile of Membership
Annual income exceeding £18,000 – 53%
Annual income at or below £18,000 – 47%
Since our inception, we have fostered a dynamic network that has grown to 2,450 active members. Our community reflects a broad economic spectrum: while 53% of our cohort earns above £18,000, nearly half (47%) subsist on or below this margin. This distribution highlights our dedication to inclusivity, ensuring that our resources and financial support remain accessible to those navigating the most significant economic hurdles.
A Nationwide Network, Rooted in Community
Geographically, our community is anchored in London (58%), with growing representation across the East of England (12%) and South East (11%), and emerging networks in the North West and the Midlands. We also have a small but growing presence in Scotland (0.3%), reflecting our ambition to become a truly national organisation. This distribution reflects both our London roots and our commitment to reaching members nationwide.
England membership by region and percentage share
| Region / area | Members | Share |
|---|---|---|
| London | 1,669 | 68.1% |
| South East | 190 | 7.8% |
| East of England | 160 | 6.5% |
| West Midlands | 87 | 3.6% |
| North West | 65 | 2.7% |
| South West | 47 | 1.9% |
| East Midlands | 37 | 1.5% |
| Yorkshire and the Humber | 37 | 1.5% |
| North East | 13 | 0.5% |
| Total England | 2,305 | 94.1% |
Scotland membership by region and percentage share
| Region / area | Members | Share |
|---|---|---|
| Glasgow | 45 | 1.8% |
| Edinburgh | 29 | 1.2% |
| Rest of Scotland | 12 | 0.5% |
| Total Scotland | 86 | 3.5% |
Rest of UK membership by region and percentage share
| Region / area | Members | Share |
|---|---|---|
| Wales | 3 | 0.1% |
| Northern Ireland | 2 | 0.1% |
| Total Rest of UK | 5 | 0.2% |
Other membership category and percentage share
| Region / area | Members | Share |
|---|---|---|
| Unspecified / UK | 54 | 2.2% |
Grand total UK membership
| Region / area | Members | Share |
|---|---|---|
| All UK & Other | 2,450 | 100% |
As of December 2025, DiNN’s membership stood at 2,450, with London (68%) and the South East (8%) remaining our largest regions. This growth reflects a sustained increase in programme activity: between 2023 and 2025, we ran 90 online and in‑person events, while our Mighty Networks continues to offer free courses and training that lower the barrier for new joiners. Newer initiatives have been particularly effective at attracting people outside our existing networks – for example, our Wellcome application alone drew over 200 applicants, most of whom had never heard of DiNN before.
Our real‑time membership has continued to rise, illustrating this ongoing momentum. Total membership in the first quarter of 2026 now stands at just over 3,100. This continued growth is driven by the same factors: an expanding portfolio of non‑grant programmes, consistent engagement through events, and the welcoming structure of the Mighty Networks. The Wellcome programme remains a strong example of how targeted opportunities bring new members into DiNN, sustaining our growth into 2026.
Racial Identity and Gender Identity
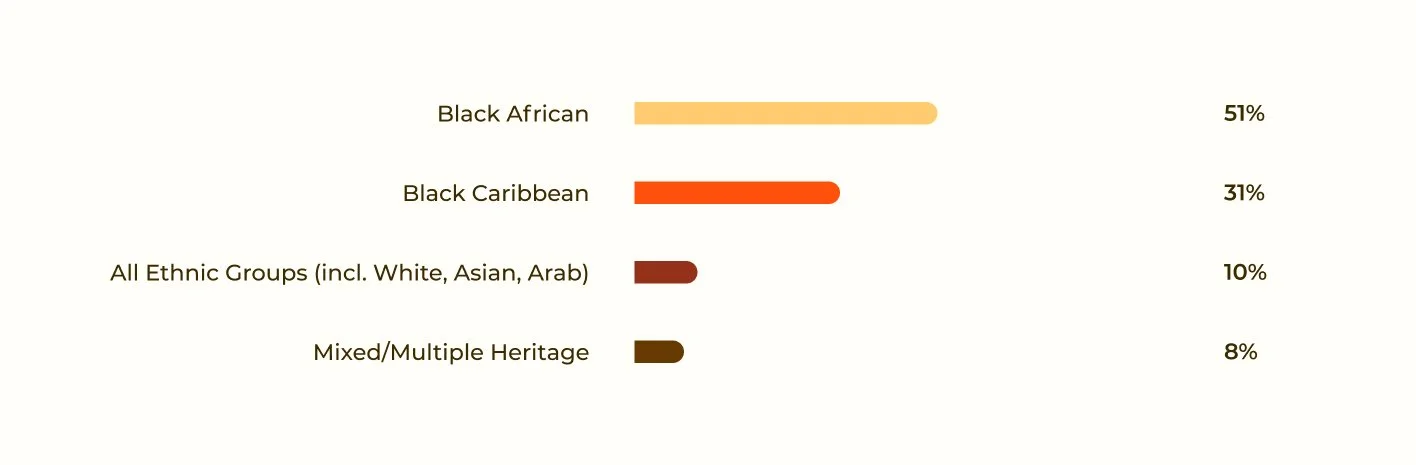
Figure 1: Racial Identity
Do it Now Now is a Black‑focused organisation that works with and for Black and Global Majority communities. Our mandate is clear: at least 50% of the people we support identify as Black. This target relates to our membership and programme participant demographics – not the demographics of organisations applying for an Expression of Interest (EOI). This ensures we remain deeply rooted in Black communities while remaining open to all who share our mission.
As the chart shows, 51% of our members identify as Black African, 31% as Black Caribbean, 8% as Mixed/Multiple Heritage, and 10% as other ethnic groups (including White, Asian, and Arab). This composition reflects our commitment to centring Black experiences while embracing the diversity of the Global Majority.
Figure 2: Gender Identity Across Our Community
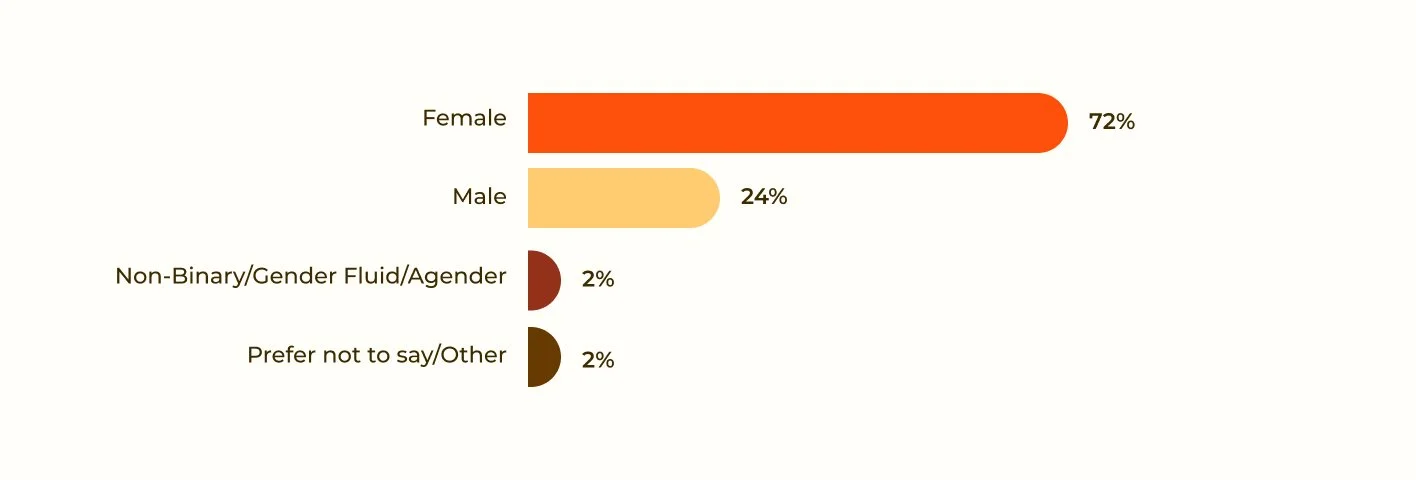
The majority of people who engage with our programmes are women‑led, and our membership data reflects this. As the chart shows, 72% of our members identify as female, while 24% identify as male. A further 2% identify as non‑binary, gender fluid, or agender, and 2% preferred not to say or selected another option.
While we encourage male representation across all our activities. While women, particularly Black women and women from Global Majority backgrounds, are at the forefront of much community‑led change, we welcome and support people of all genders. The current composition simply represents who has engaged with us to date.
Figure 3: LGBTQ+ identity
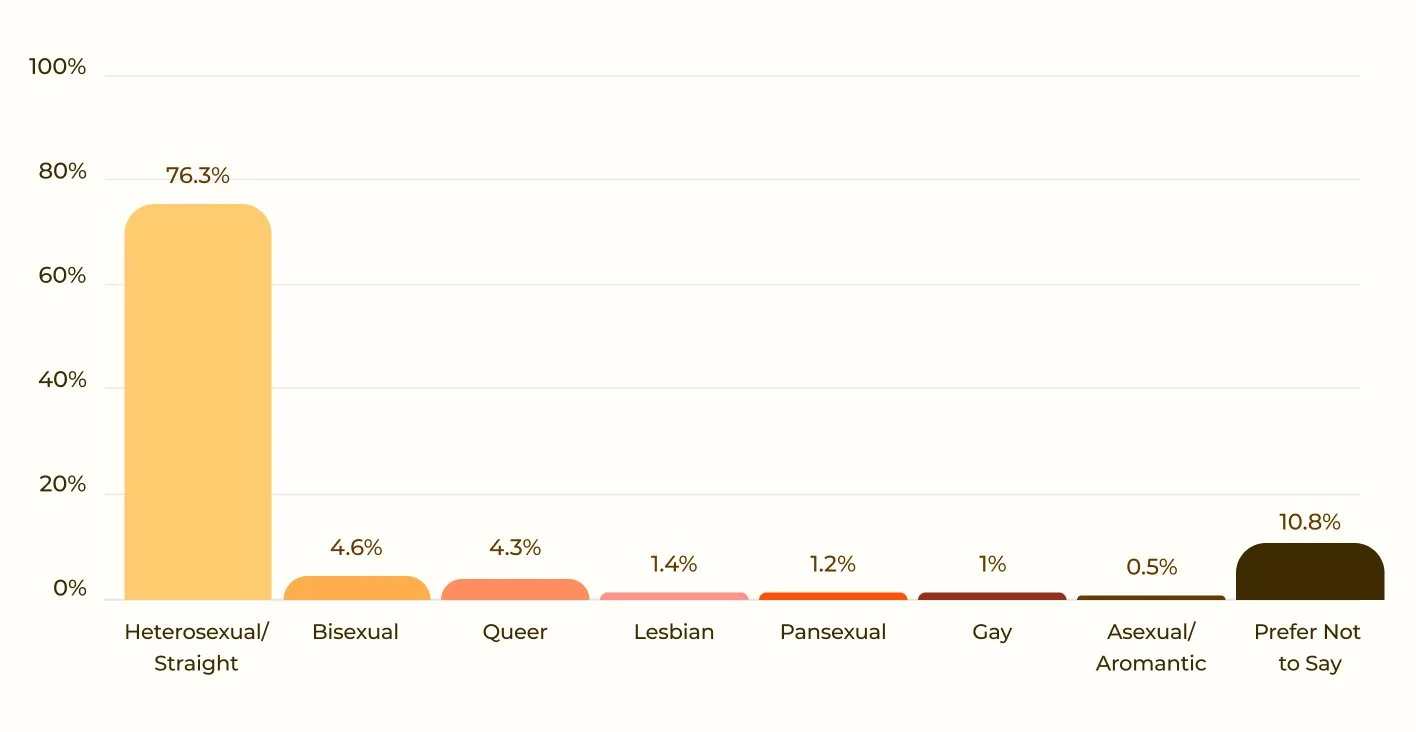
The majority of our members (76.3%) identify as heterosexual or straight. In total, 13% identify as LGBTQI+ (including bisexual, queer, lesbian, pansexual, gay, and asexual/aromantic), while 10.8% prefer not to say.
This composition reflects the diversity of orientations we work with across all our interventions. We are committed to creating an inclusive environment where people of all identities feel welcome and supported, recognising that LGBTQI+ individuals from Black and Global Majority backgrounds face distinct challenges that our programmes seek to address.
Education, Disability and Age Profile
Figure 4: Education Levels
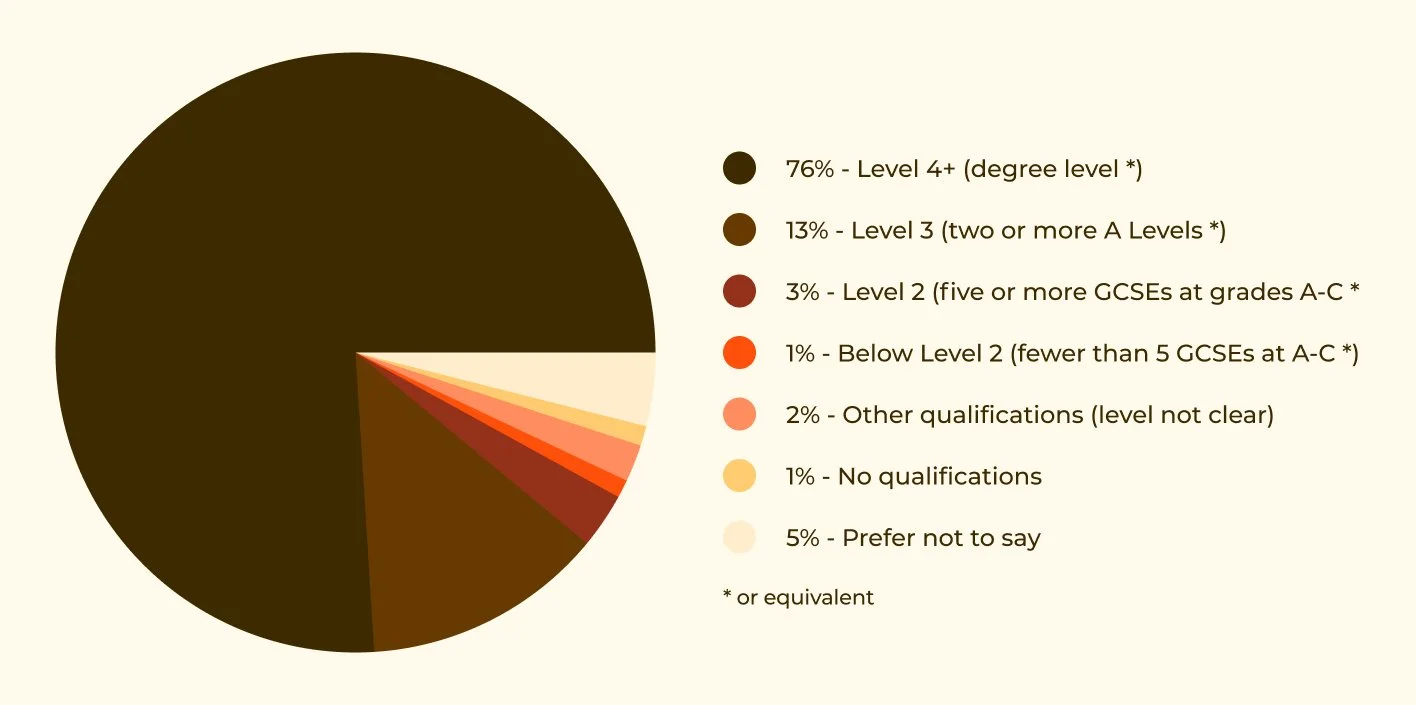
Our membership is strongly skewed towards highly educated individuals. Over three‑quarters (76%) hold a Level 4+ qualification (degree level or equivalent), while a further 13% have Level 3 qualifications (two or more A Levels or equivalent). Only 2% have no qualifications or below Level 2, and 5% prefer not to say.
Many of our members are professionals in various fields who run Community Interest Companies (CICs) to support the communities they live in. This combination of high educational attainment and grassroots commitment enables them to bring both expertise and lived experience to their work.
Disability & Neurodiversity
Figure 5: Disability
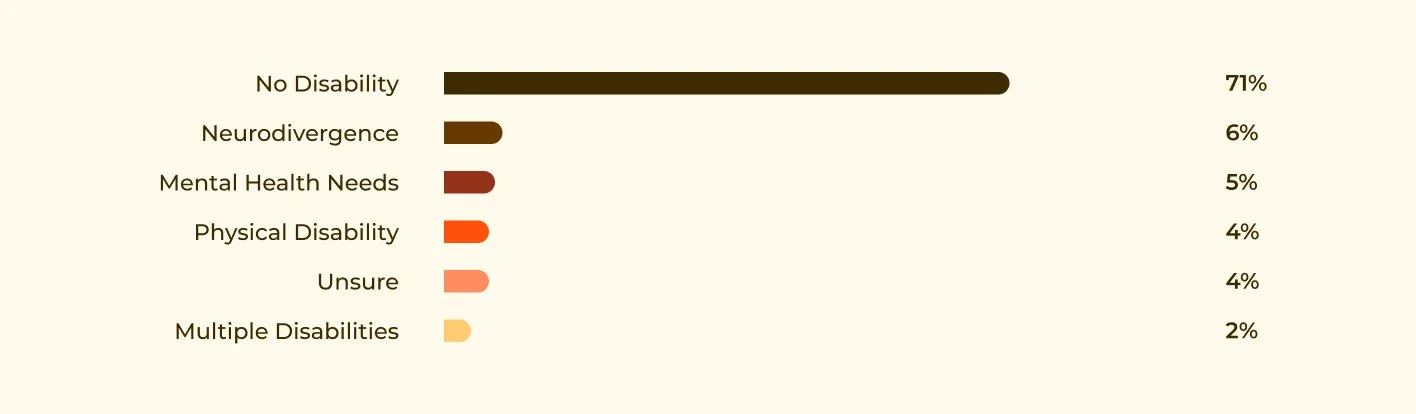
Nearly three in ten of our members identify as having a disability or neurodivergence, with neurodivergence (6%), mental health needs (5%), and physical disability (4%) being the most common. A further 2% have multiple disabilities, most frequently a combination of mental health needs and neurodivergence. While the majority (71%) report no disability, these figures remind us that a significant portion of our community navigates additional challenges, many of which are not immediately visible.
Understanding these diverse needs is essential to our work. Drawing on best practices from guides such as Neuroinclusion in the Workplace and Supporting Neurodiversity in the Workplace, we use our data to learn and make reasonable adjustments for neurodivergent members. This includes offering flexible communication (clear written instructions, pre‑meeting materials), sensory‑friendly environments (quiet zones, adjustable lighting), and assistive technology (speech‑to‑text, visual schedules). By listening to members and tailoring support to individual needs, whether for ADHD, autism, dyslexia, or other forms of neurodivergence, we create an inclusive space where everyone can participate fully.
Age Profile of Our Membership
Figure 7: Age Profile
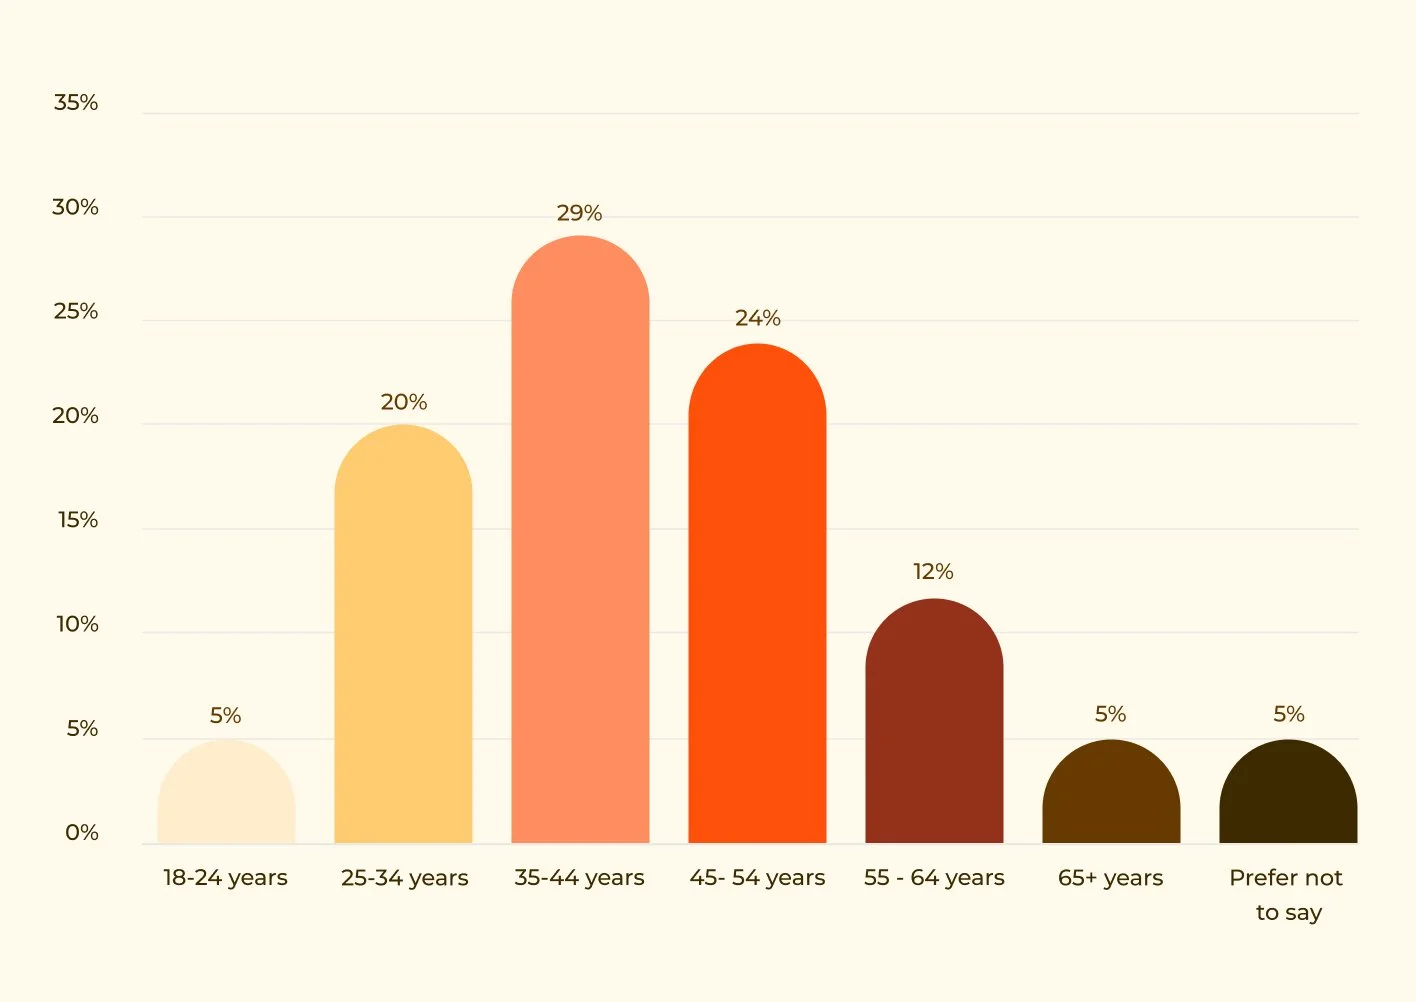
Our membership spans generations, with the largest groups in their prime working and leadership years: 29% are aged 35–44, 24% are 45–54, and 20% are 25–34. Older adults (55–64 at 12%, 65+ at 5%) and younger members (18–24 at 5%) are also well represented, while 5% prefer not to say or are unknown.
Our programmes are designed to be suitable and relevant to different demographics, from youth to senior citizens, ensuring that everyone can benefit in whatever form best suits their needs. Whether someone is starting their career, leading a community organisation, or bringing decades of experience, our support adapts to where they are.
Programme Participation
2471 engaged in an on-demand learning management system
1299 attended online training workshops
413 initiatives supported in 6 month-long programmes
213 initiatives received grant funding
Total grant funding disbursed £2,654,723
Since 2023, Do it Now Now has delivered 20 programmes, supporting 413 organisations and individuals through structured, multi‑month initiatives. These include flagship programmes such as Build, Hustle, Grow (early‑stage businesses), Innovate Now (growth‑stage enterprises), Starting Up, Starting Out (idea‑stage ventures), and Big Business (established non‑profits and social enterprises). Of the 413 initiatives, 213 received direct grant funding, with a total of £2.65 million disbursed.
Beyond these programmes, we offer on‑demand learning through our Side Hustle Support course on Mighty Networks, a self‑paced, 16‑resource programme that helps members build the foundations of their businesses. We also run in-person events, such as a full‑day Social Investment workshop featuring panel sessions with funders and social investors, and attendee feedback helps us continuously improve.
Financially, £2.55 million (96%) of our direct funding went to core support in funded organisations (staff, premises rent, and other key operational expenses), while £104,723 (4%) covered direct Service User Expenses (travel, accessibility, and other essential costs). Our grant‑making is distributed across three key funders: Pathway Fund (46%), City Bridge Foundation (45%), and Impact on Urban Health (9%), reflecting our commitment to supporting organisations at every stage of growth, from grassroots ideas to established community anchors.
Grantee Profile
Fig 8: Legal Structure
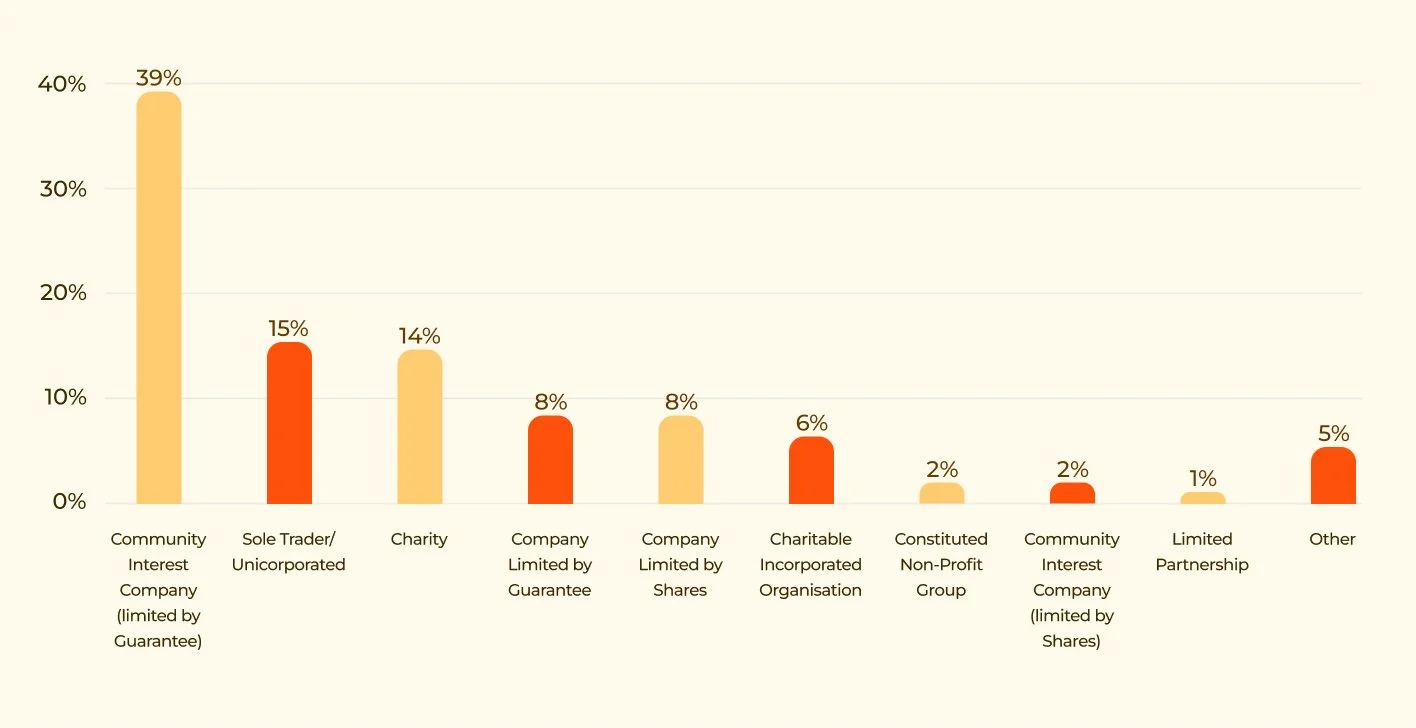
The organisations we work with span a range of legal structures, reflecting the diverse nature of Black and Global Majority‑led enterprises. Community Interest Companies (CICs) make up the largest group, 50% in total. Within that, 48% are CICs limited by guarantee, while only 2% are CICs limited by shares. This distinction matters: CICs limited by guarantee include an asset lock, meaning any profits or assets must be reinvested into the community mission. This aligns directly with the eligibility requirements for much of our grant funding, which is why this structure is so strongly represented in our work.
A further 15% are sole traders or unincorporated businesses, typically early‑stage startups or idea‑stage ventures that join programmes such as Starting Up, Starting Out. Charities and charitable incorporated organisations together account for 20%, while companies limited by guarantee or shares account for 8% each. The remaining 5% fall into other categories (including limited partnerships and constituted non‑profit groups). This distribution reflects our commitment to supporting organisations at every stage of their journey, from individual entrepreneurs taking their first steps to established community anchors with formal asset locks.
Fig 9: Annual Income
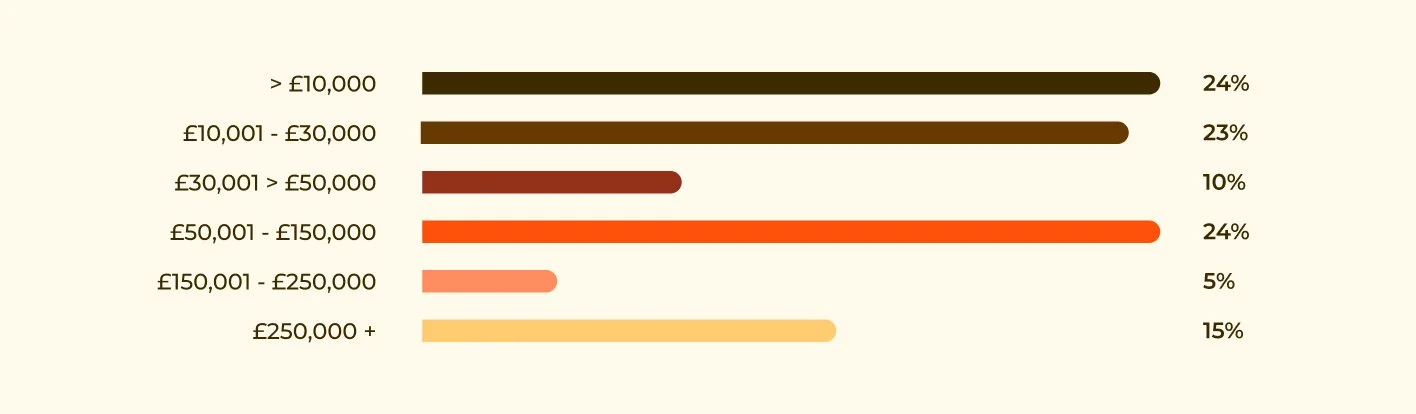
The chart shows a balanced spread across income bands, with notable clusters at the lower end (≤£10k at 24% and £10k–£30k at 23%) and the mid‑range (£50k–£150k also at 24%). This distribution is not accidental; it reflects the design of our programmes, each of which targets organisations at specific income levels. For example:
Starting Up Starting Out: income £0–£10,000 (idea stage)
Build, Hustle, Grow: income £10,000–£30,000 (early stage)
Innovate Now: income £30,000–£150,000 (development stage)
Make it Big: income £150,000–£400,000 (growth stage)
Big Business: income £30,000–£1 million (social investment)
Fig 10: Years Incorporated
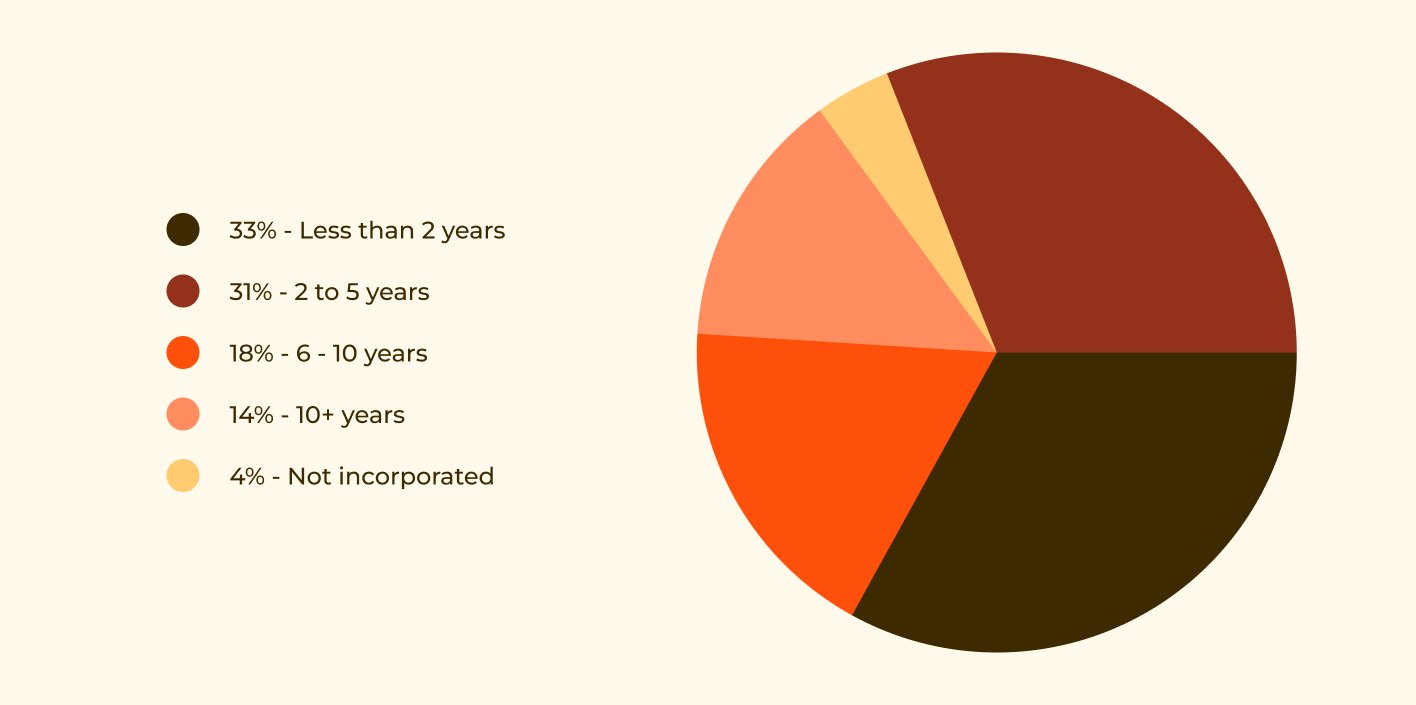
Across all our programmes, the organisations we work with span a wide age range. The largest groups are relatively young: 33% have been incorporated for less than 2 years, and 31% for 2–5 years, together accounting for nearly two‑thirds. A further 18% are 6–10 years old, 14% are 10+ years, and 4% are not incorporated (typically sole traders or unincorporated groups).
This distribution reflects the diversity of our portfolio. While we support many early‑stage ventures, we also work with established organisations that have been operating for a decade or more. This mix ensures that our programmes benefit organisations at different stages of maturity, from grassroots startups to long‑standing community anchors.
Fig 11: Impact Areas
Our grantee community is diverse in structure, scale, and focus. Community Interest Companies (CICs) form the largest group at 41% (39% limited by guarantee and 2% limited by shares), reflecting a strong commitment to social mission alongside enterprise. Sole traders (15%) and charities (14%) also represent significant portions of our network.
In terms of income, our grantees span the full spectrum. Nearly half (47%) earn £30,000 or less, while 20% earn above £150,000. This diversity reflects our commitment to supporting organisations at every stage of growth.
Nearly two-thirds (64%) of our grantees have been incorporated for less than five years, reflecting our focus on nurturing early-stage and emerging organisations. At the same time, 32% have been operating for six years or more, demonstrating our reach to more established community anchors.
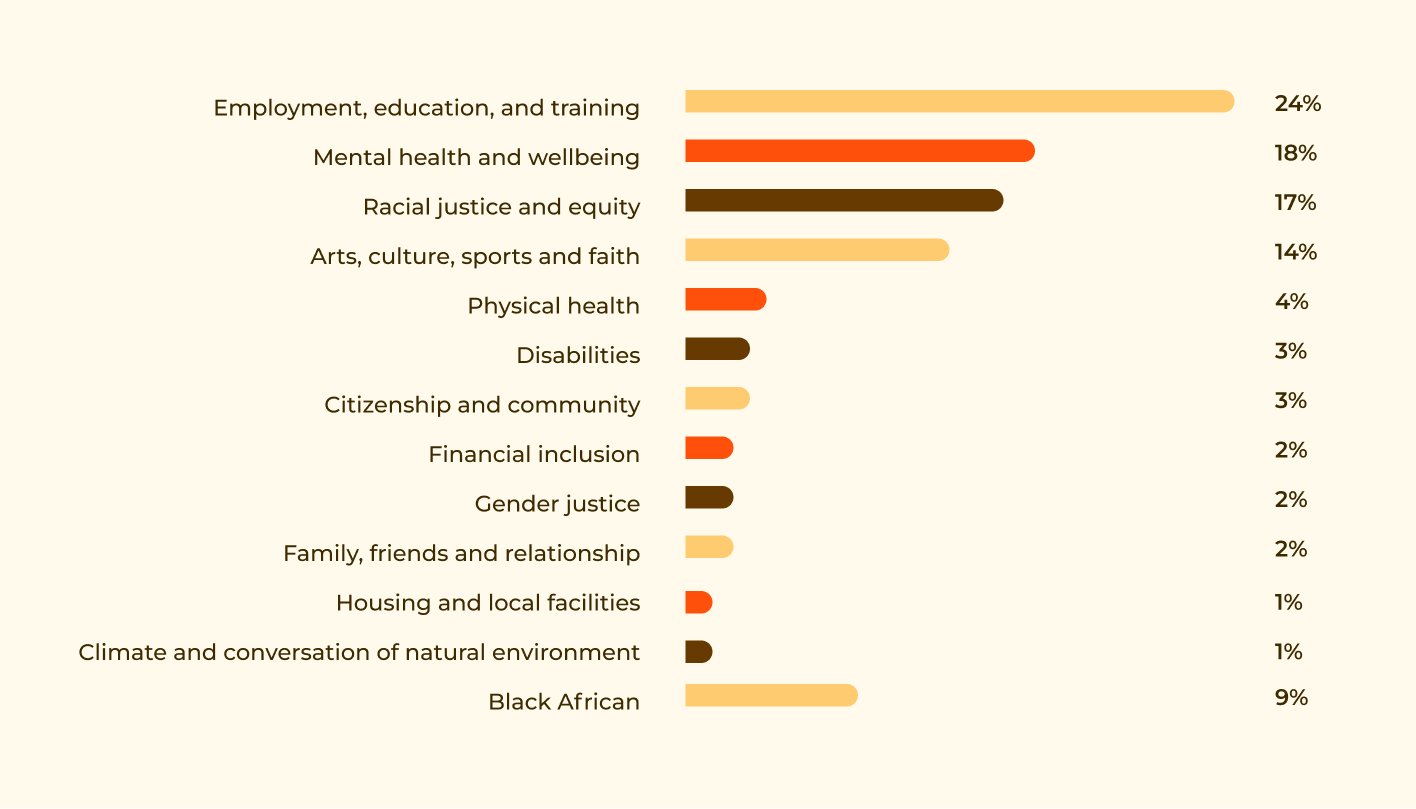
Our grantees are tackling a wide range of issues. The most common focus areas are employment, education, and training (24%); mental health and well-being (18%); and racial justice and equity (17%). Arts, culture, and sports (14%) also feature strongly, reflecting the changemakers’ roots in our community. This spread shows how our funding supports both economic opportunity and wellbeing, two pillars of thriving communities.
Measuring Our Impact: Pre‑ and Post‑Programme Survey Results
To understand how our programmes change organisations for the better, we collect data at two key points: pre‑programme (during onboarding, before support begins) and post‑programme (within six months of completion). For our flagship Innovate Now programme with City Bridge Foundation (2023–2025), we achieved a 70% response rate across both surveys, giving us confidence that the results are representative of the 64 organisations supported. The results demonstrate a profound alignment with our Theory of Change: moving Black-led organisations from "surviving" to "thriving."
Building Resilient Foundations
The core of our Level 3 support is capacity building. We saw leadership confidence in hiring and management jump from 53% to 81%, a shift that manifested in immediate physical growth. 62% of participants expanded their teams, proving that the funding and mentorship provided weren't just "gap-fillers" but catalysts for expansion. As one charity leader reflected, "Getting the structures and processes in place made our operations smoother and more efficient—a game changer for our long-term sustainability." This internal strengthening is reflected in our Health Check assessments, where average scores rose from 3.3 to 3.9 out of 4.
Scaling Impact through Strategic Equity
True to our Theory of Change, the impact of Innovate Now ripples far beyond the individual organisations. We saw a surge in strategic collaborations, with the proportion of organisations forming new diverse partnerships rising from 66% to 91%. Crucially, over half of these were explicitly focused on advancing racial equity. The scale of this reach is best seen in the success of one youth-focused organisation that, through new corporate ties, expanded its delivery from two to five London boroughs. By reaching an additional 1,600 young people, they proved that organisational health is the direct precursor to community transformation.
"We secured new corporate partnerships with UK Power Networks, Salesforce, and Airbus... 94% of our young people gained clarity on life goals, and one participant even launched their own podcast."
The Road Ahead: A Growing Pipeline of Innovation
While the City Bridge Foundation programme marks a major milestone, it is just the beginning of a broader movement. Our current data from over 79 organisations across our Starting Up, Starting Out, and Build, Hustle, Grow pipelines reveals an ecosystem brimming with untapped potential and fierce resilience.
The Next Generation of Impact
These emerging leaders are not just building businesses; they are tackling systemic inequalities. From a Black-led neurodivergent support project to initiatives partnering with the NHS and The Royal Ballet, the breadth of our Level 1 and 2 cohorts is staggering. Even before receiving full support, 42% of these leaders have identified "Systemic Policy Change" and "Economic Empowerment" as their primary long-term goals.
Nuggets of Resilience & Ambition:
The "Fight" for Sustainability: One leader in our pipeline shared their motivation: "I want to reignite my business... I want to make sure I don’t go out without a fight." This spirit is what we are nurturing in our upcoming cycles.
Bridging the Capacity Gap: A common theme among our new cohorts is the move from ideas to action. As one participant noted: "The bottleneck isn’t knowledge, it’s the capacity to implement... I want to take action toward my goals rather than just conceptualise them."
Expansion of the Flagship: With Innovate Now Round 4 (Impact on Urban Health) already underway, we are applying our proven Level 3 model to health equity, ensuring that the "Innovate Now" standard becomes a permanent fixture in the London landscape.
Health checks
At Do it Now Now, we don’t just fund organisations, we help them become more resilient, efficient, and impactful. That’s why we designed a Health Check process: a structured diagnostic that measures an organisation’s capacity across key areas such as governance, finance, HR, and programme delivery. Crucially, we tailored the Health Check to the participant, with distinct frameworks for non‑profit organisations, for‑profit businesses, and individual sole traders. This ensures that whether we are supporting a grassroots community group or a growing social enterprise, the assessment is relevant, respectful, and actionable.
Between 2023 and 2025, 115 organisations and individuals across nine of our programmes completed an initial Health Check. Most of these programmes are still running, but one, our flagship Innovate Now programme with City Bridge Foundation (Rounds 1–3), finished within the reporting period. That means we have a complete set of before‑and‑after data, giving us a clear, evidence‑based picture of what changed.
What changed
When we first met the organisations in Innovate Now R1–3, targeting organisations at the development stage, many were held together by passion alone. Governance was often informal; board meetings were held on an “ad hoc basis,” and founders carried the weight of the entire mission. One leader told us plainly: “I am the brain and passion of the organisation, if there wasn't me, the org would have closed down.” Financial systems were fragile; reserves were nonexistent, and planning was reactive: “We see an opportunity and apply.” Policies were scattered on paper, and data collection was driven by funder templates, focusing on outputs rather than lasting change.
Then we got to work. Through tailored capacity‑building, one‑to‑one mentorship, and peer learning, the same organisations transformed. Boards began meeting regularly, “challenging us and holding us to account on finance, staffing, and safeguarding.” Policies moved to centralised digital hubs, “shared during induction and reviewed annually.” Recruitment became structured, with “panel interviews and annual appraisals linked to personal development plans.” Financial safeguards appeared, “we now have a reserves policy, dual signatories, and monthly management accounts.” And strategic planning took hold: “We have a five‑year plan blending grants with earned income.”
One leader summed it up: “Getting our structures and processes in place made our operations smoother and more efficient, a game changer for our long‑term sustainability.”

The numbers tell the same story. Across the seven Health Check themes, the average score rose from 3.3 to 3.9 out of 4, an improvement of 0.6 points. The biggest leaps happened in Administration, Financial Management, and Human Resources (each +0.6), and Organisational Management (+0.7). These aren’t just abstract metrics; they represent real organisations that are now better governed, more financially stable, and ready to scale their impact. And because we started with a clear baseline and finished with a full post‑programme assessment, we know exactly what worked and what to do next.

Read More of the Impact Report 2023-2025
-
Community at a Glance
In 2025, our community grew to 2,450 members across the UK, with Black and Global Majority-led organisations at the heart of everything we do. From £2.65 million in grants disbursed to leadership confidence nearly doubling, see the data behind our growing impact.
-

Theory of Change
Our Theory of Change starts with a simple belief: when Black and Global Majority changemakers get the right support at the right stage, they build organisations that transform communities. Discover the five-level system behind DiNN's programmes, and the data proving it works.
-
How Do it Now Now Keeps Lived Experience at the Centre
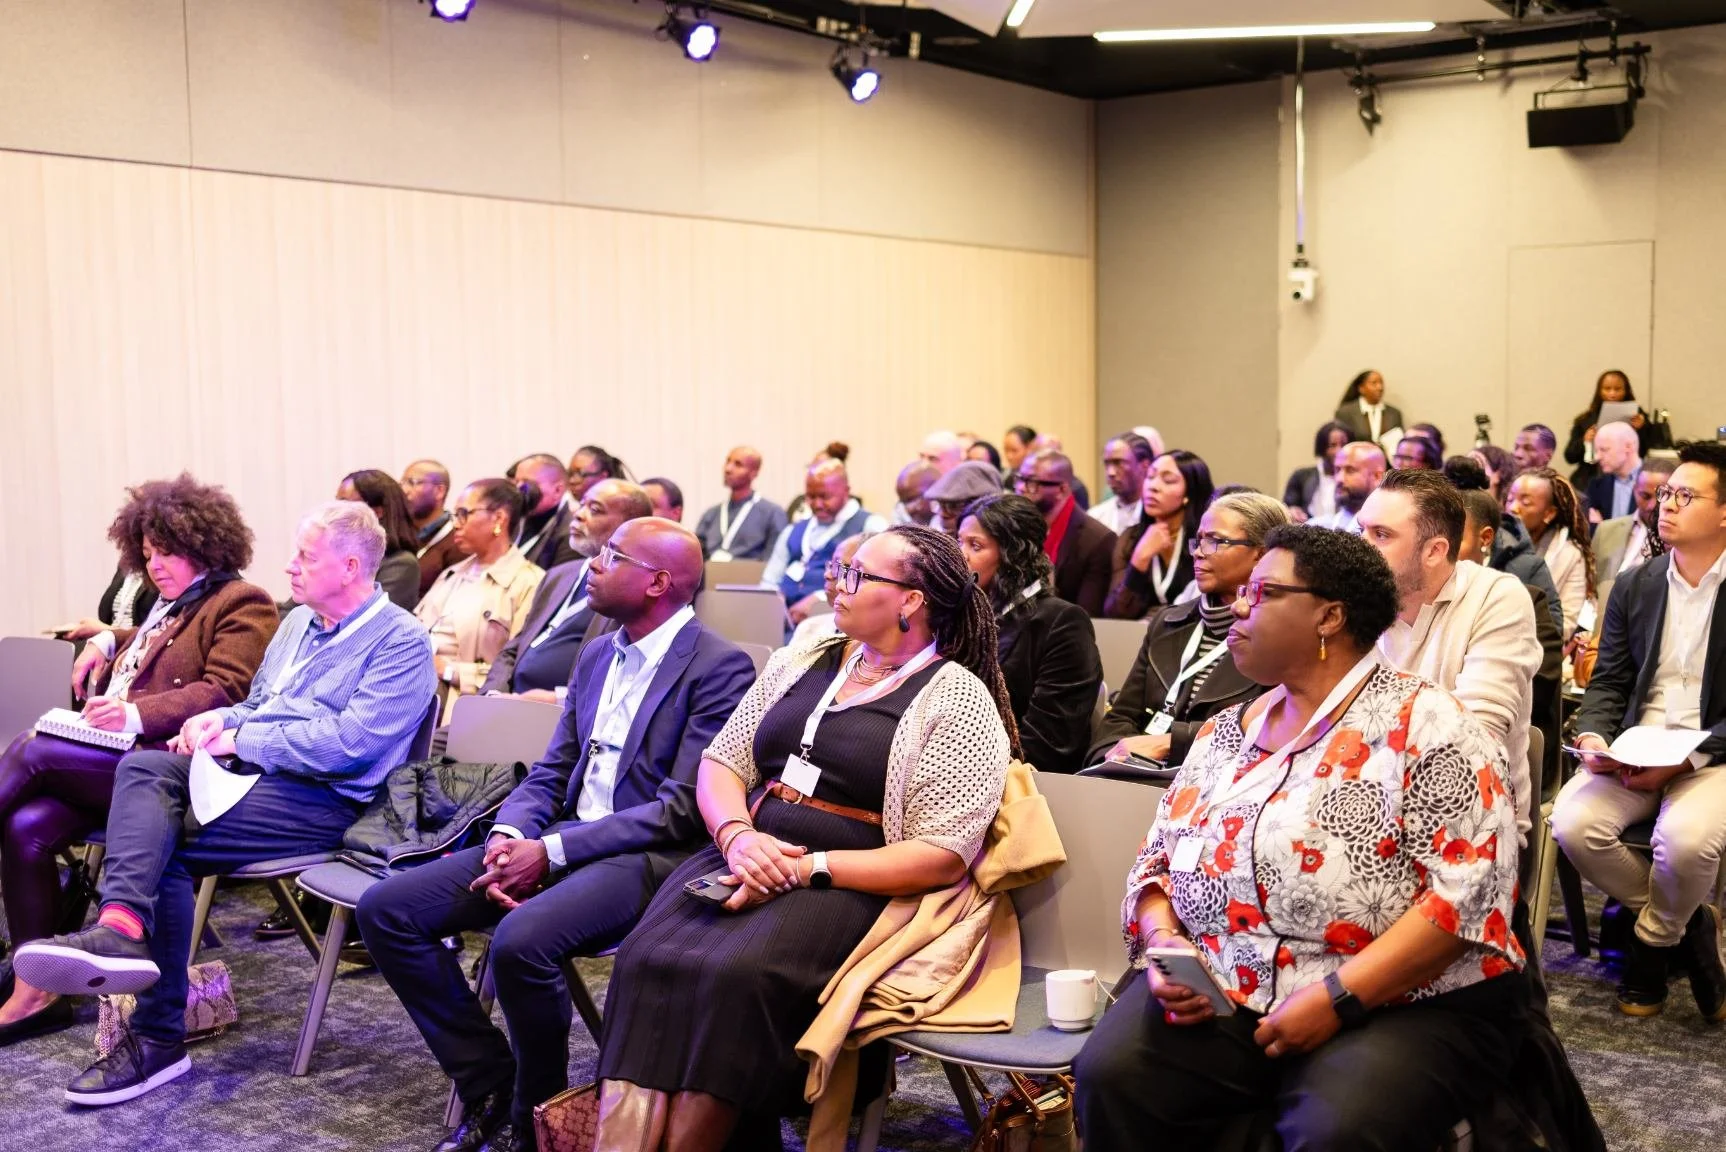
Our legitimacy doesn't come from good intentions alone. Meet the Community Advisory Board members, entrepreneurs, therapists, strategists, and alumni, who shape how Do it Now Now governs, decides, and stays accountable to the communities we serve.
-

How We Design Learning That Moves Founders From Intention To Action
Discover ASAP: our four-stage framework moving Black and Global Majority founders from Awareness through to Personalisation, helping intention become action.
-
Online Community and Alumni Support: Beyond the Programme
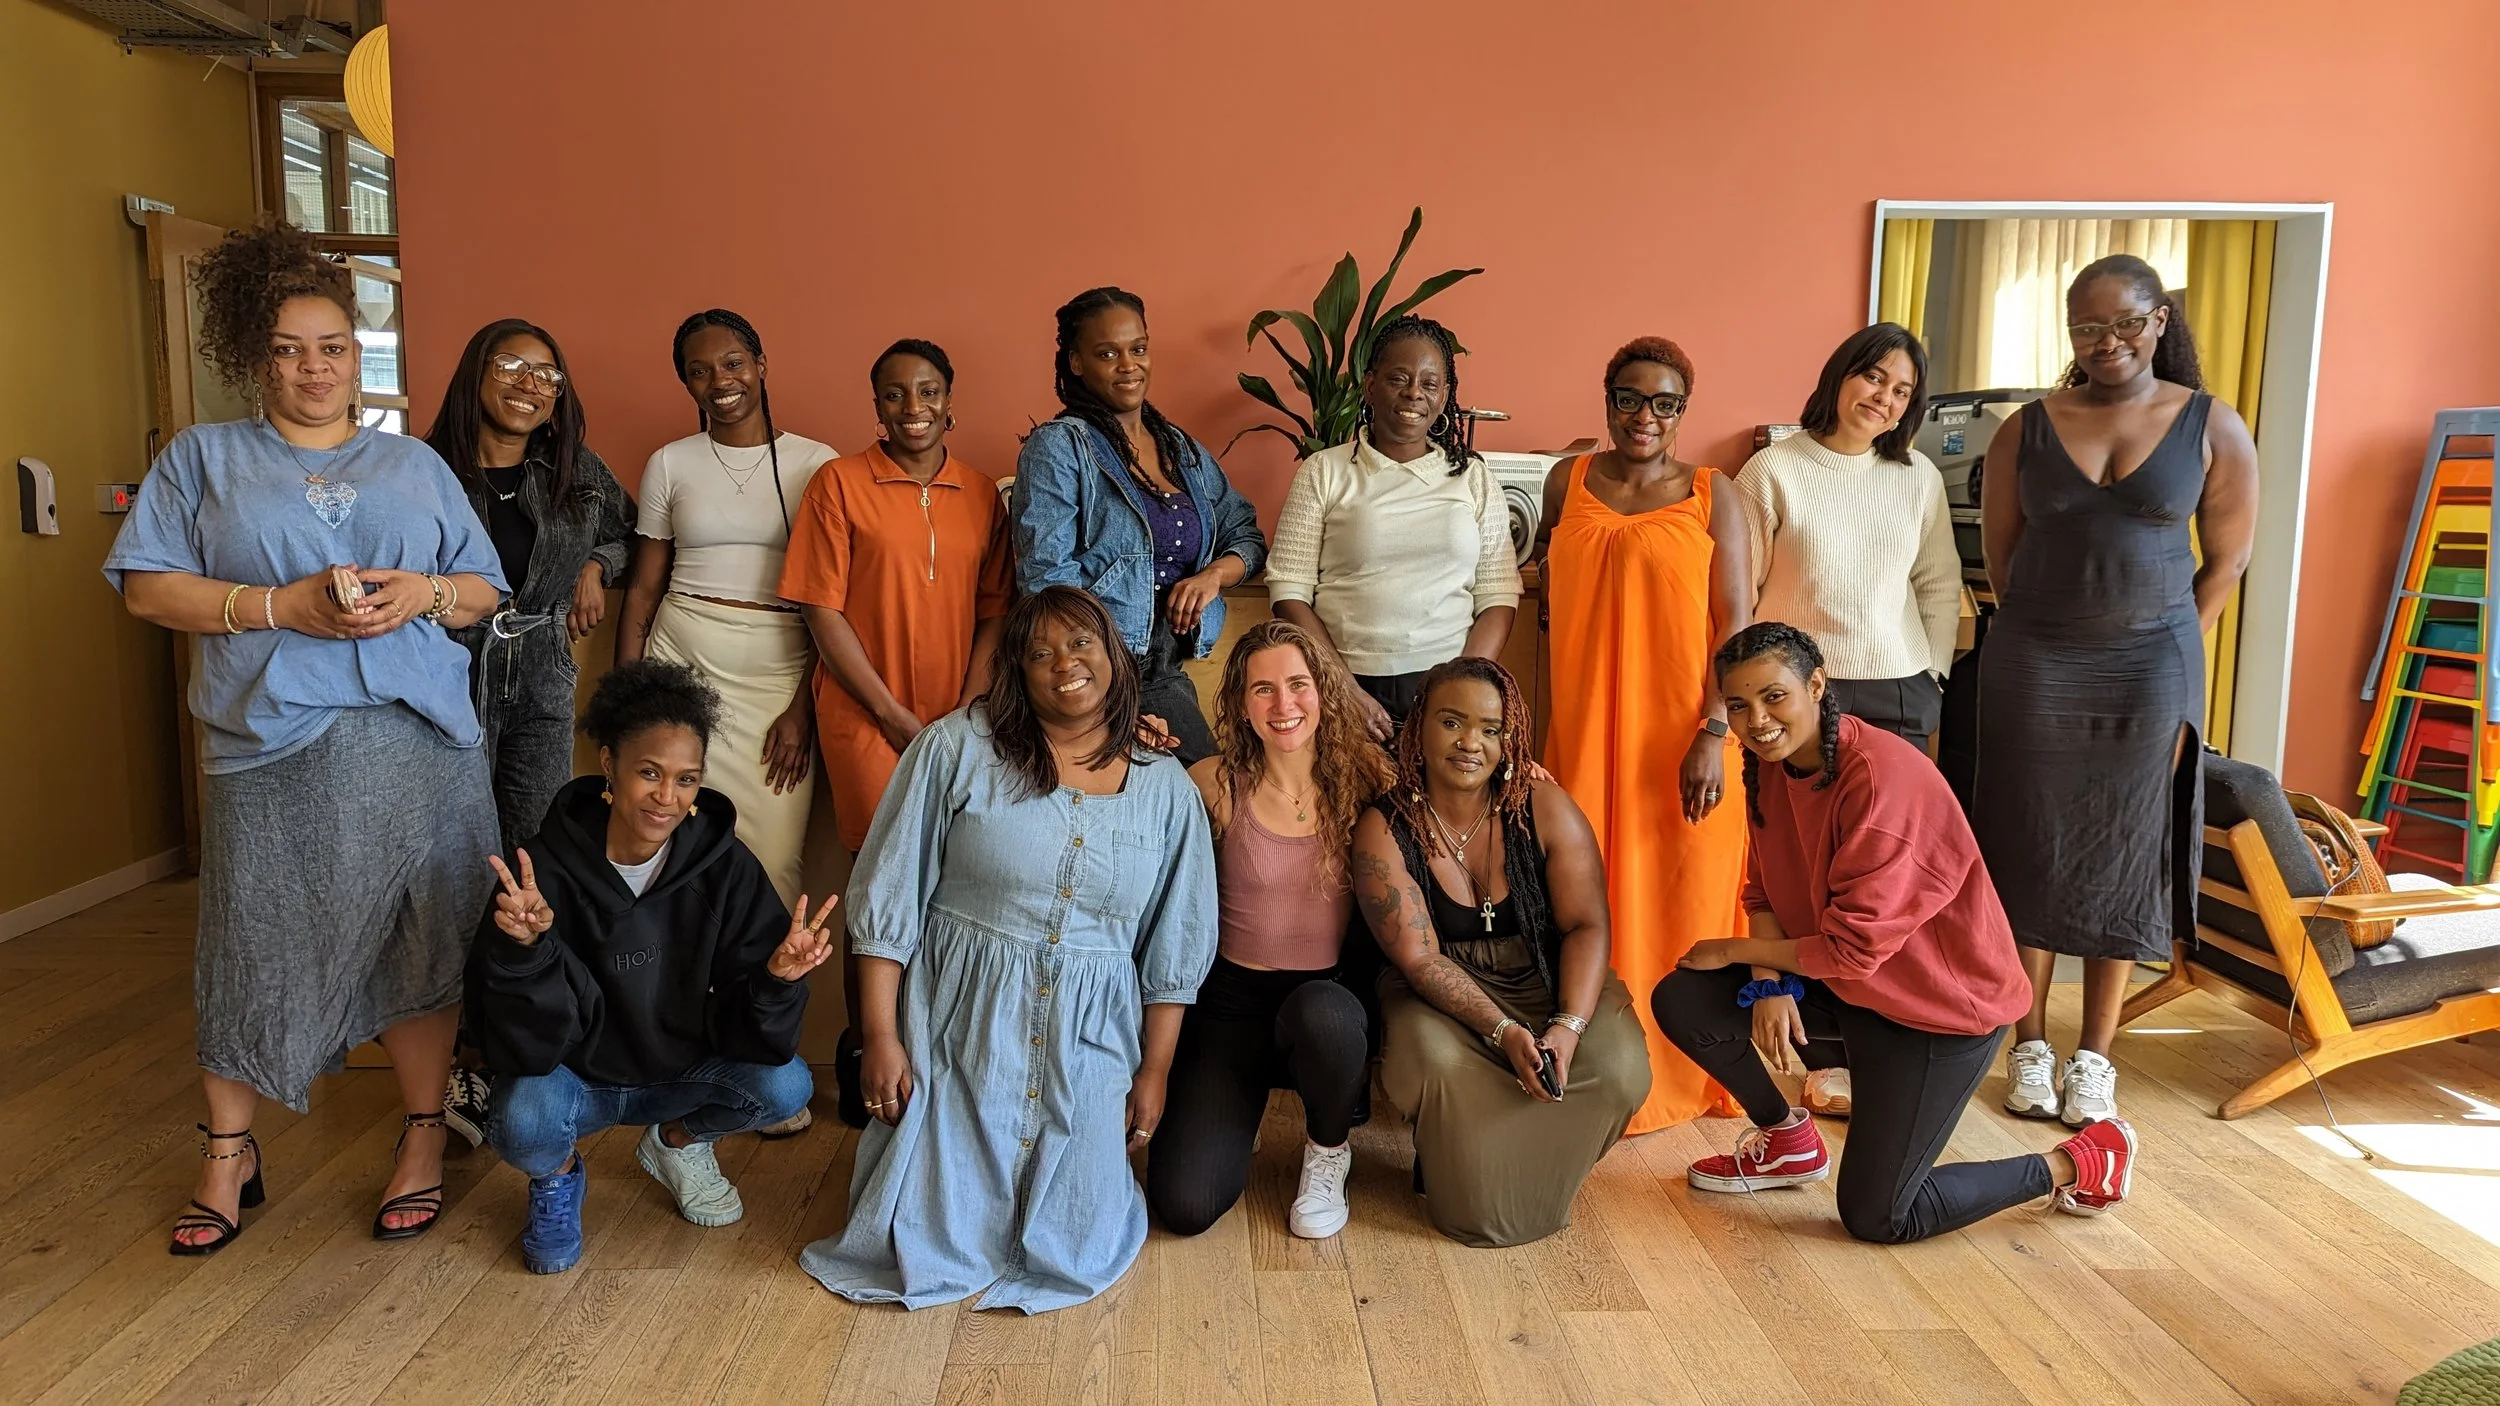
The end of a programme doesn't have to be a cliff edge. From lifetime access to training libraries to alumni dinners and peer-led workshops, discover how Do it Now Now keeps its community connected, learning, and growing long after the final session.
-
From Seed to Scale: What Five Founder Journeys Teach Us About Building Sustainable Social Enterprises
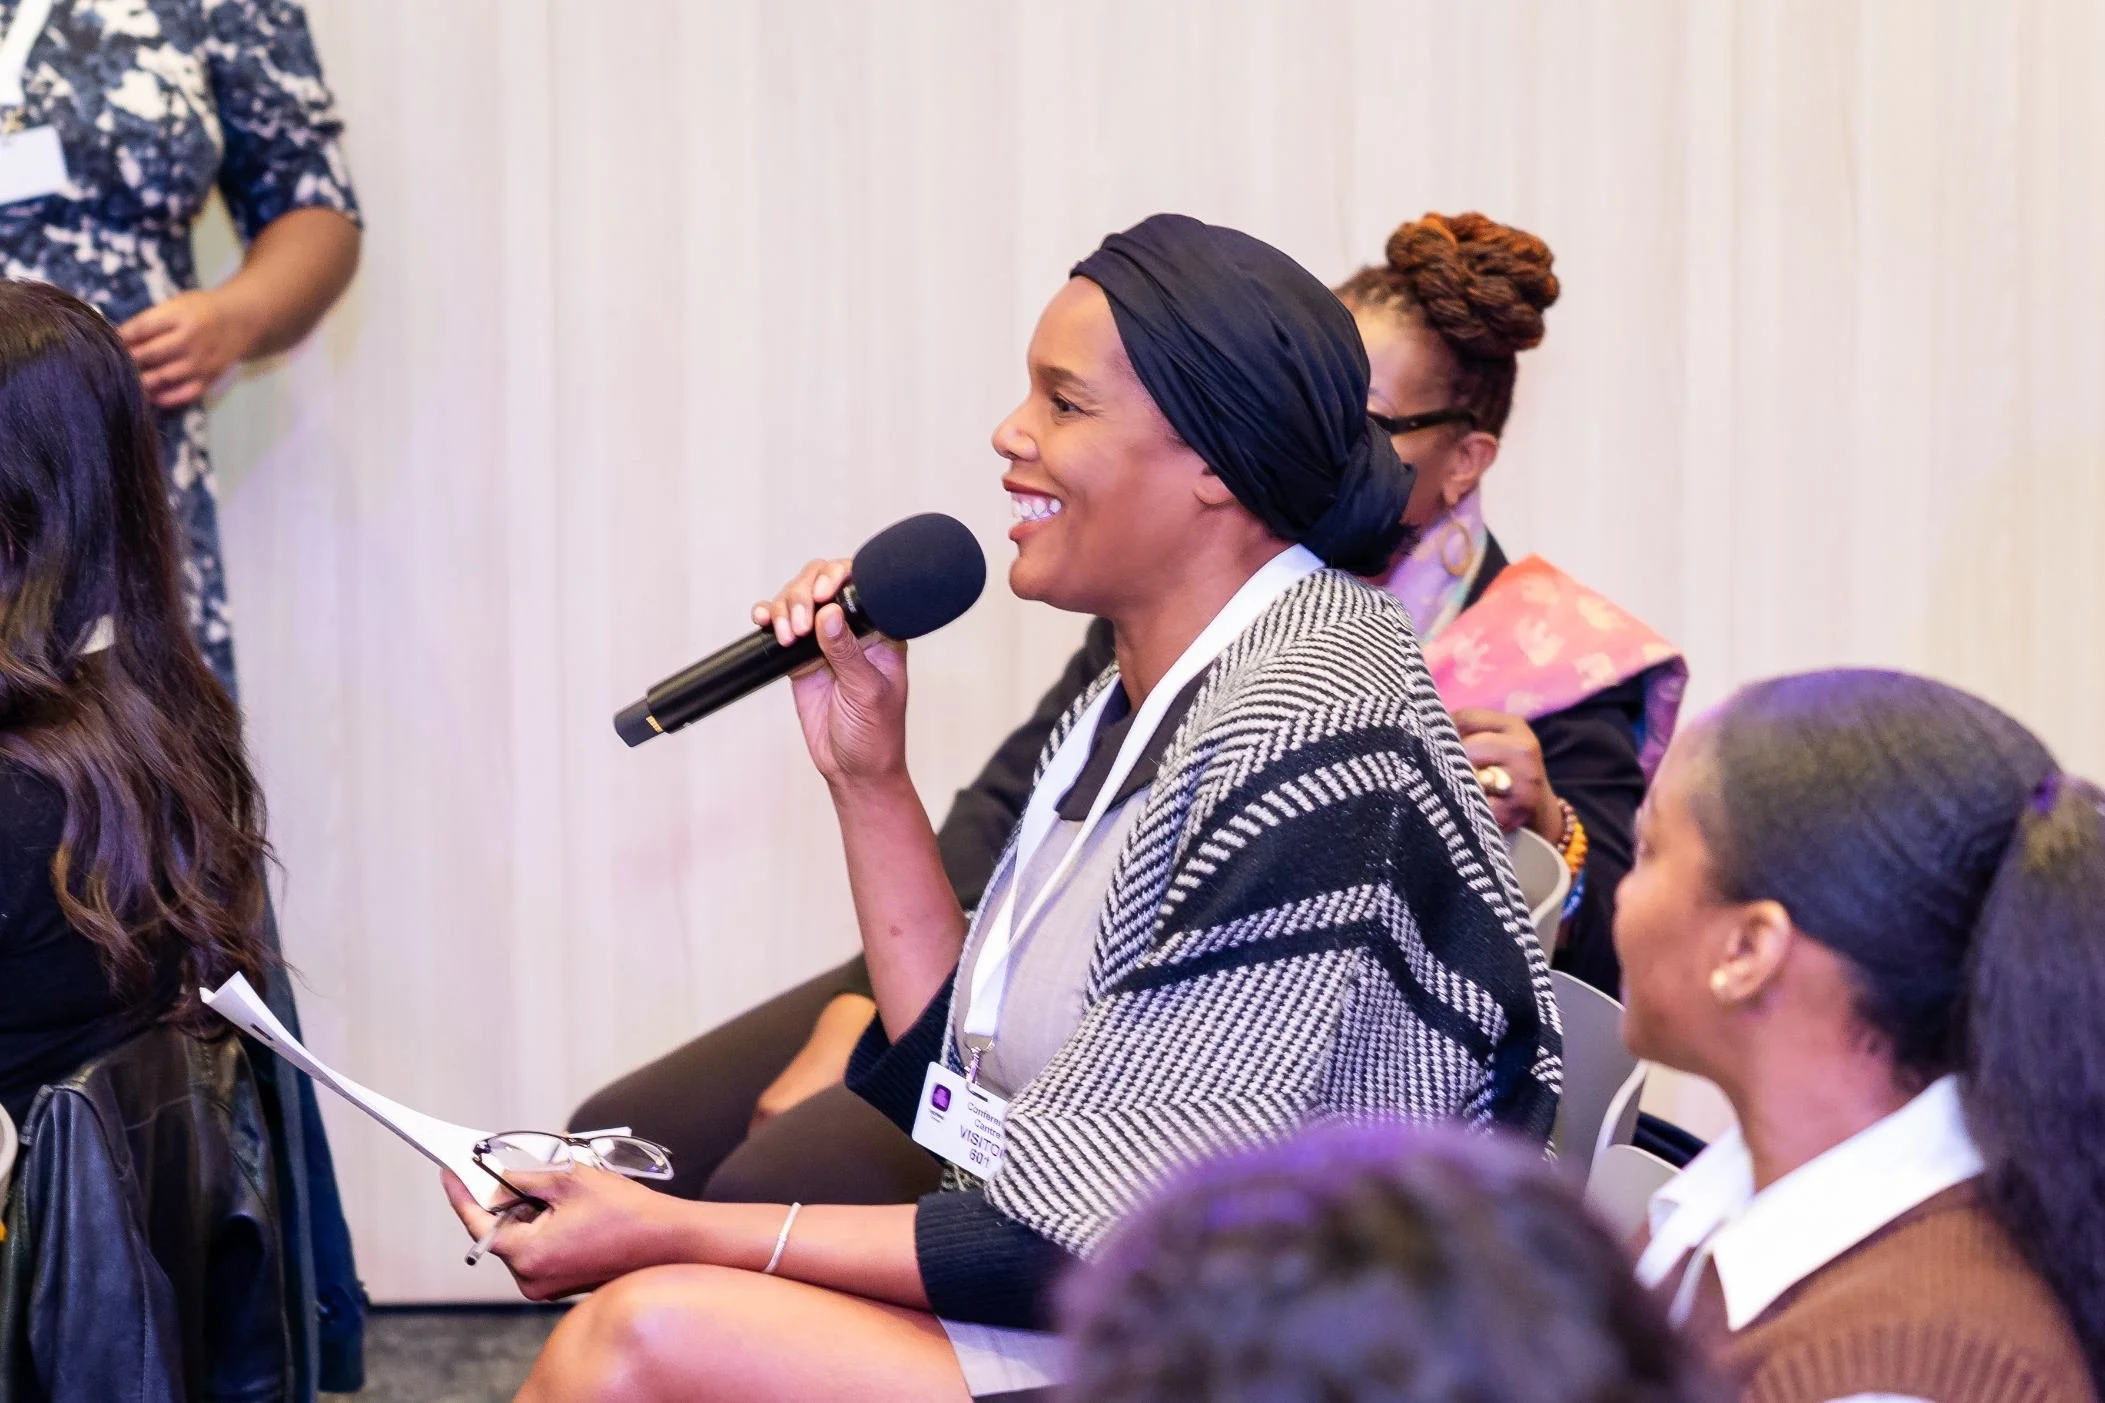
From a solo sip-and-paint business to a parkour gym facing an existential lease crisis, see how DiNN's Level-Based Programmes meet social entrepreneurs where they are, and help them build what lasts.
-
From Fragility to Resilience: What Our Health Checks Reveal
Every organisation we work with completes a developmental Health Check, first at baseline, then months later. Across 64 organisations in our Innovate Now programme, scores rose with significant gains in governance, finance, and community impact.
-
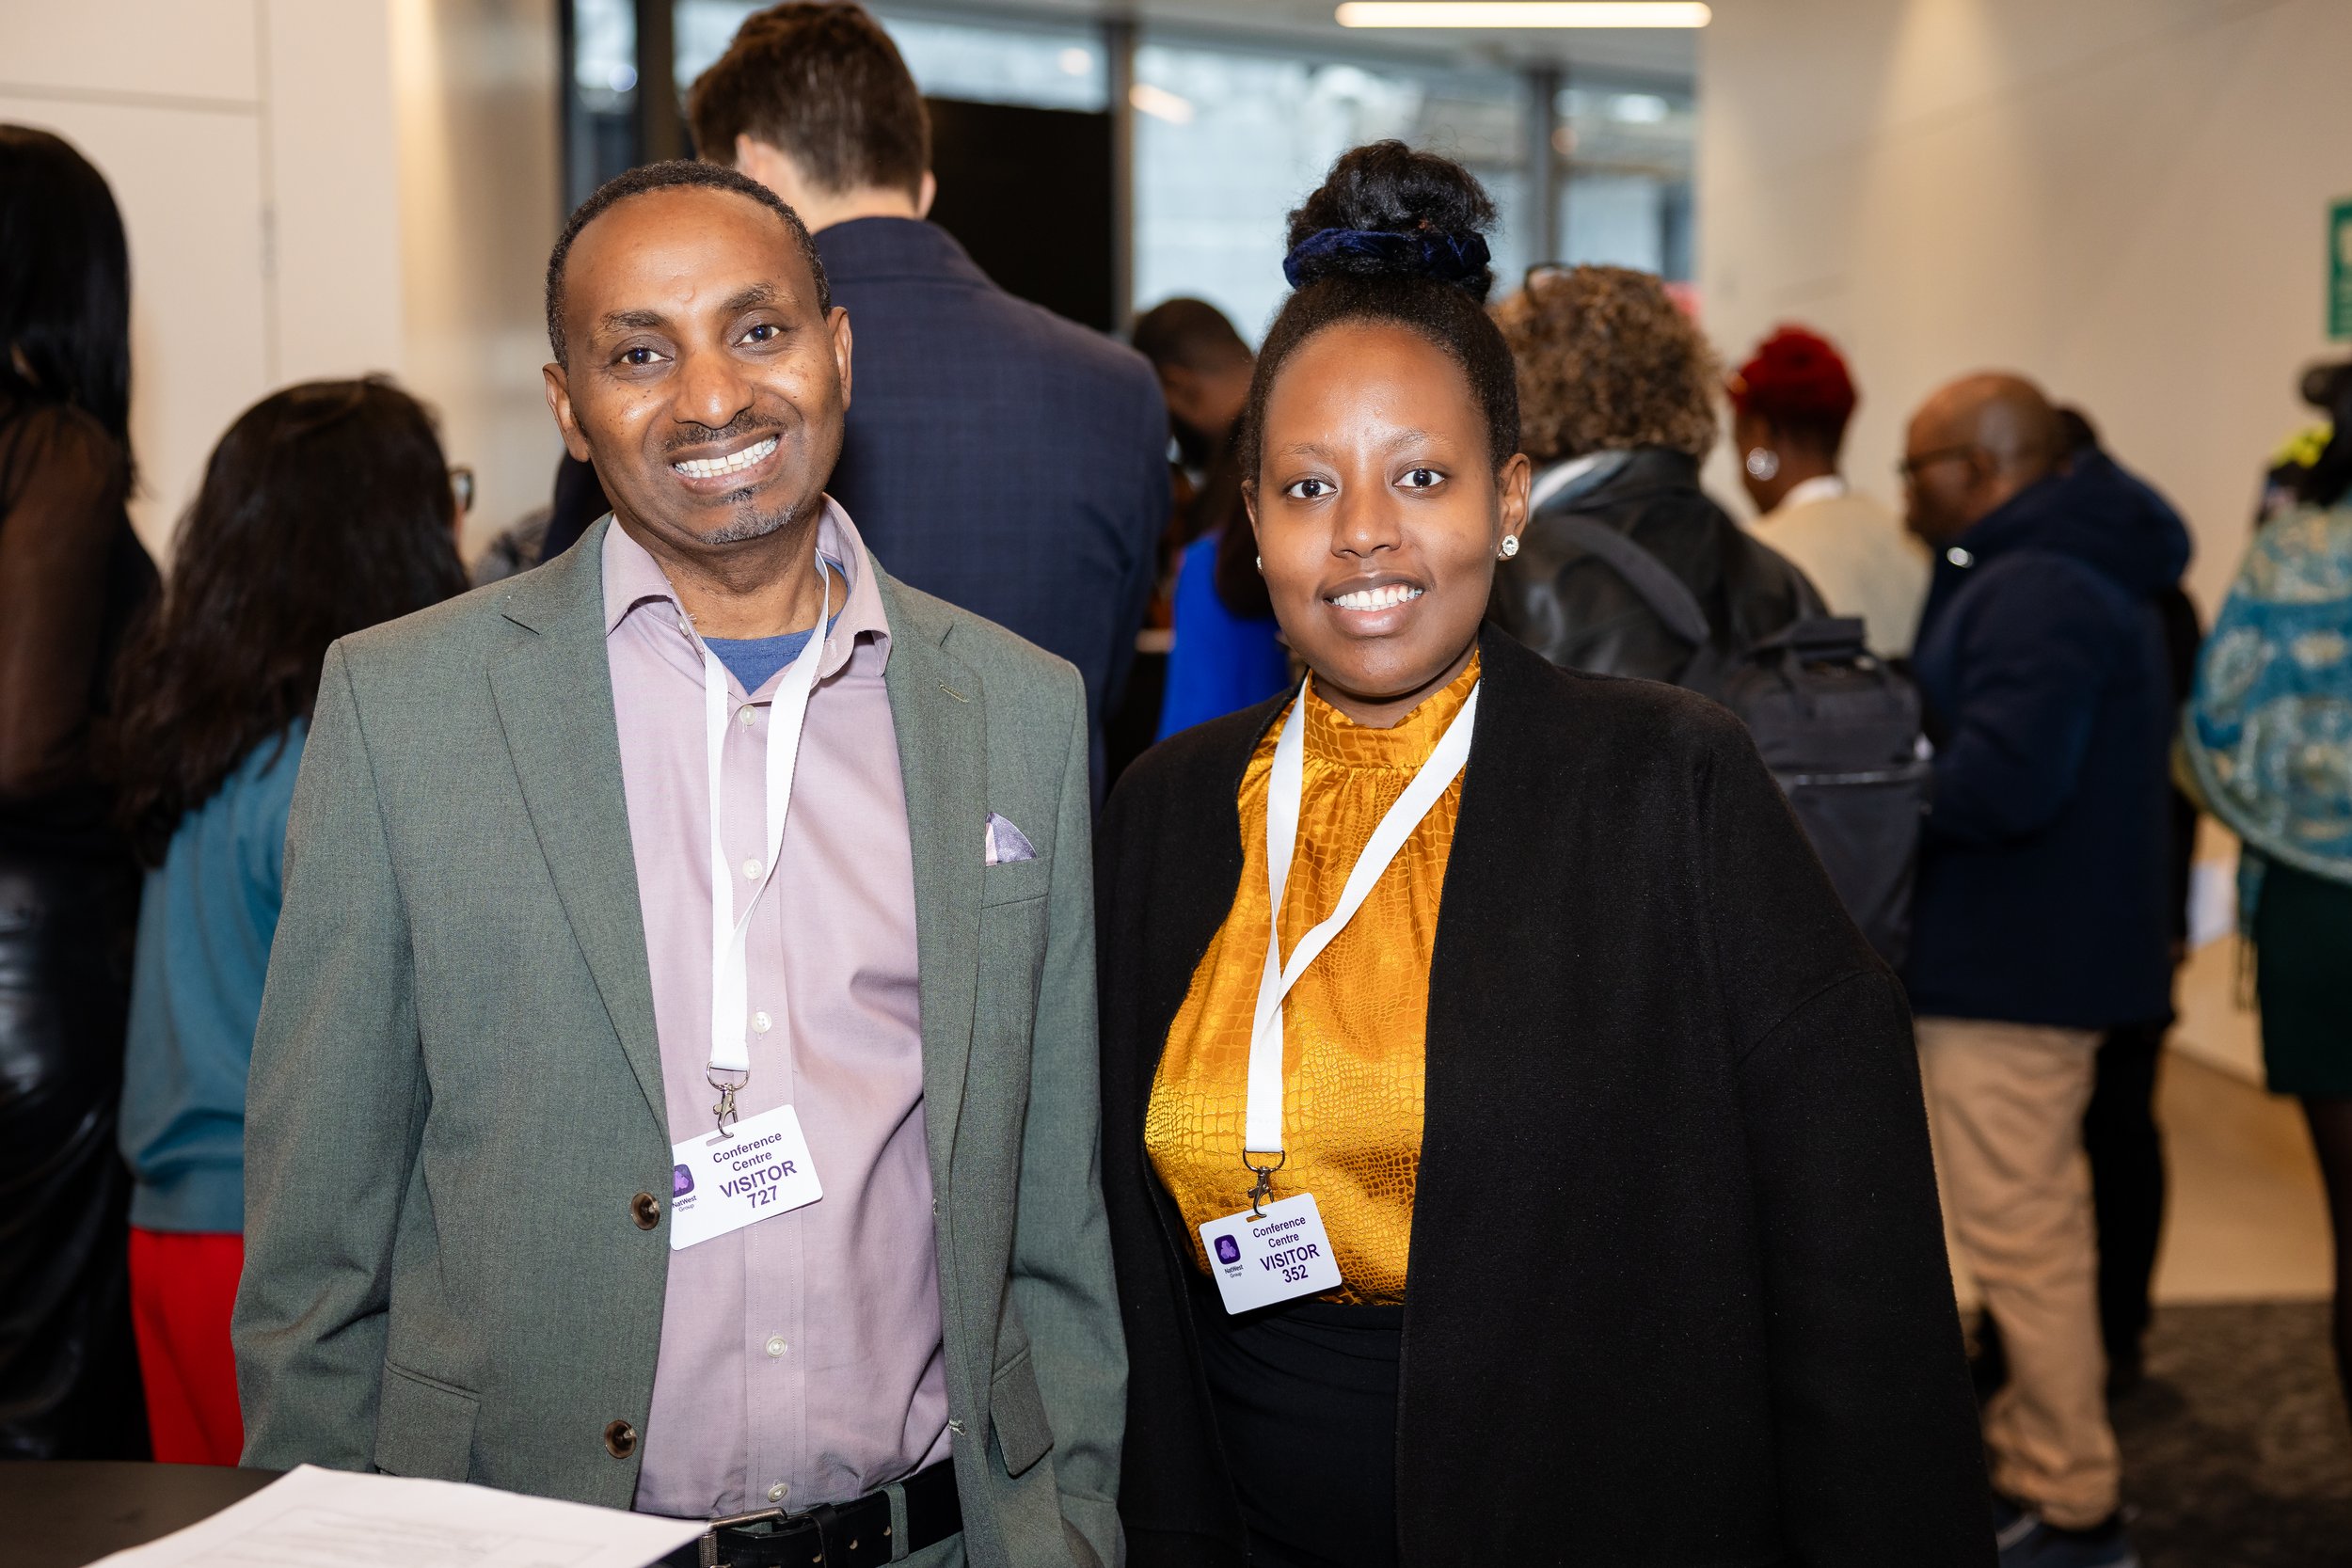
The Evidence for Impact: How DiNN Programmes Turn Learning into Outcomes
A strong programme leaves people encouraged and equipped to act. See the data behind DiNN's outcomes, tracking how confidence, partnerships, and funding shift for participants in the months after they complete a programme.
-
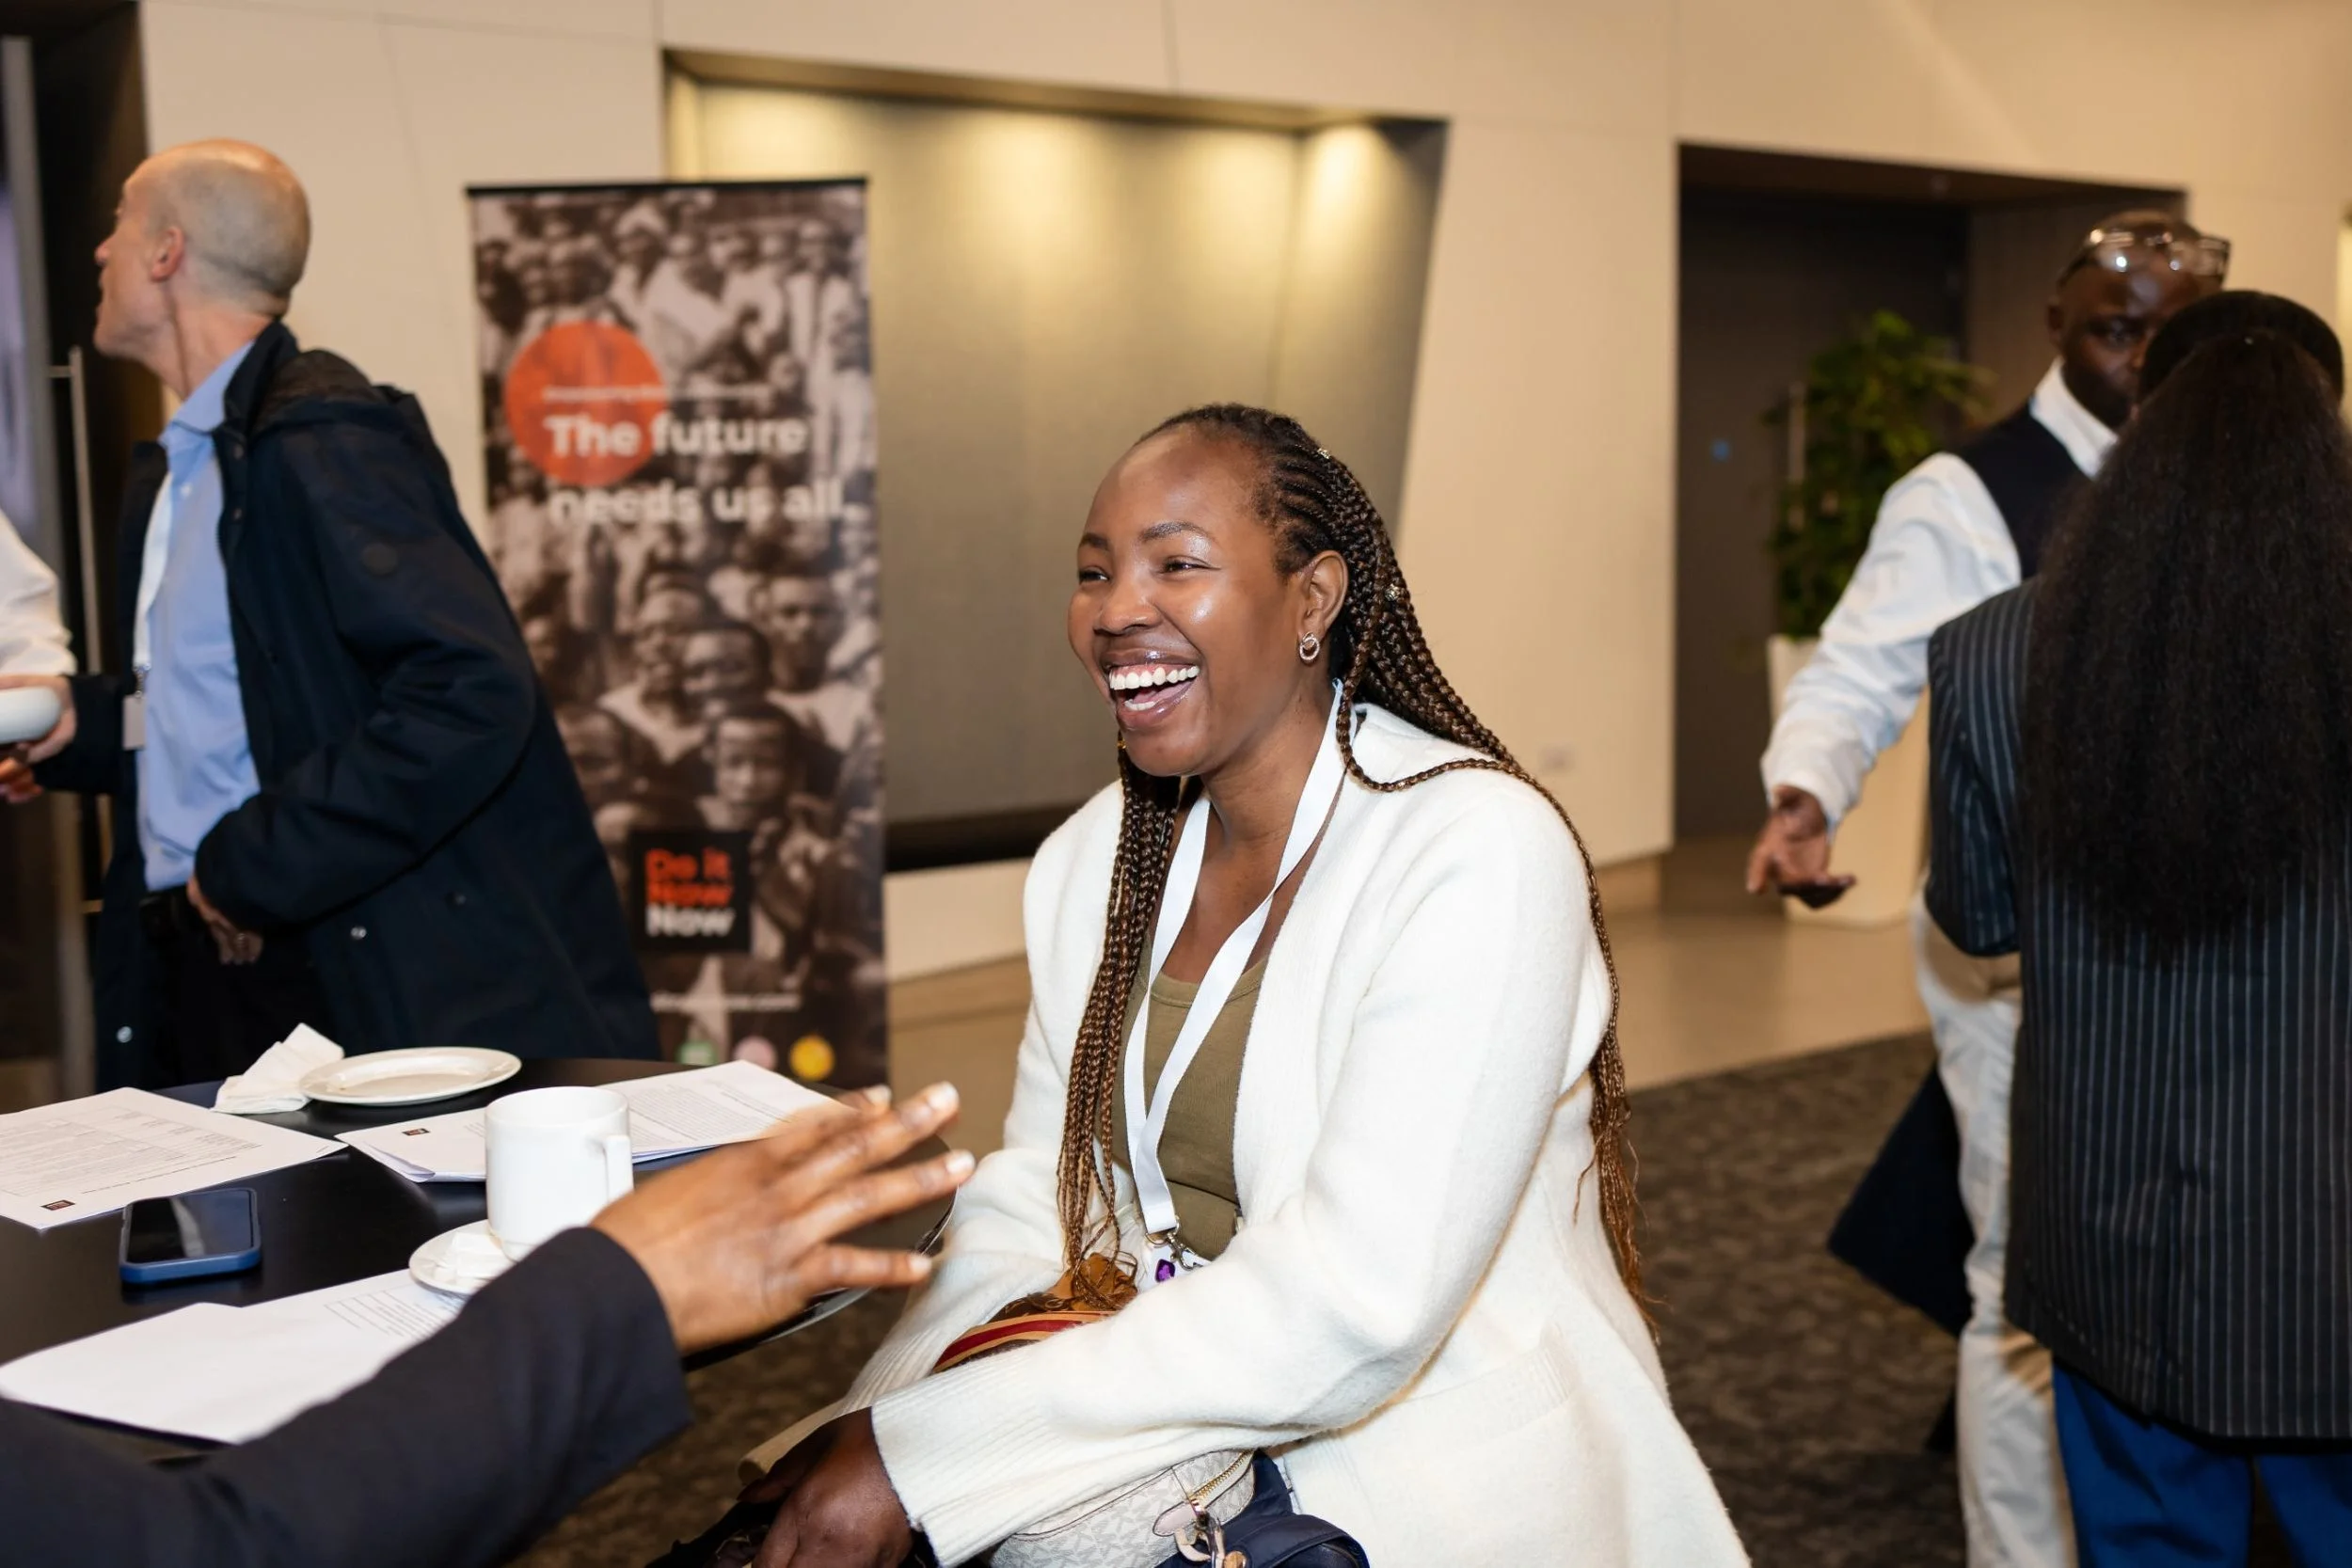
Why The Journey Does Not End When a Programme Finishes
Support rarely arrives as one clean intervention. It's a Health Check here, a grant there, a mentoring session somewhere else. Meet Carib Eats, MEM Academy, and Youth League UK, three founders whose journeys show what happens when support becomes a connected pathway instead.
-
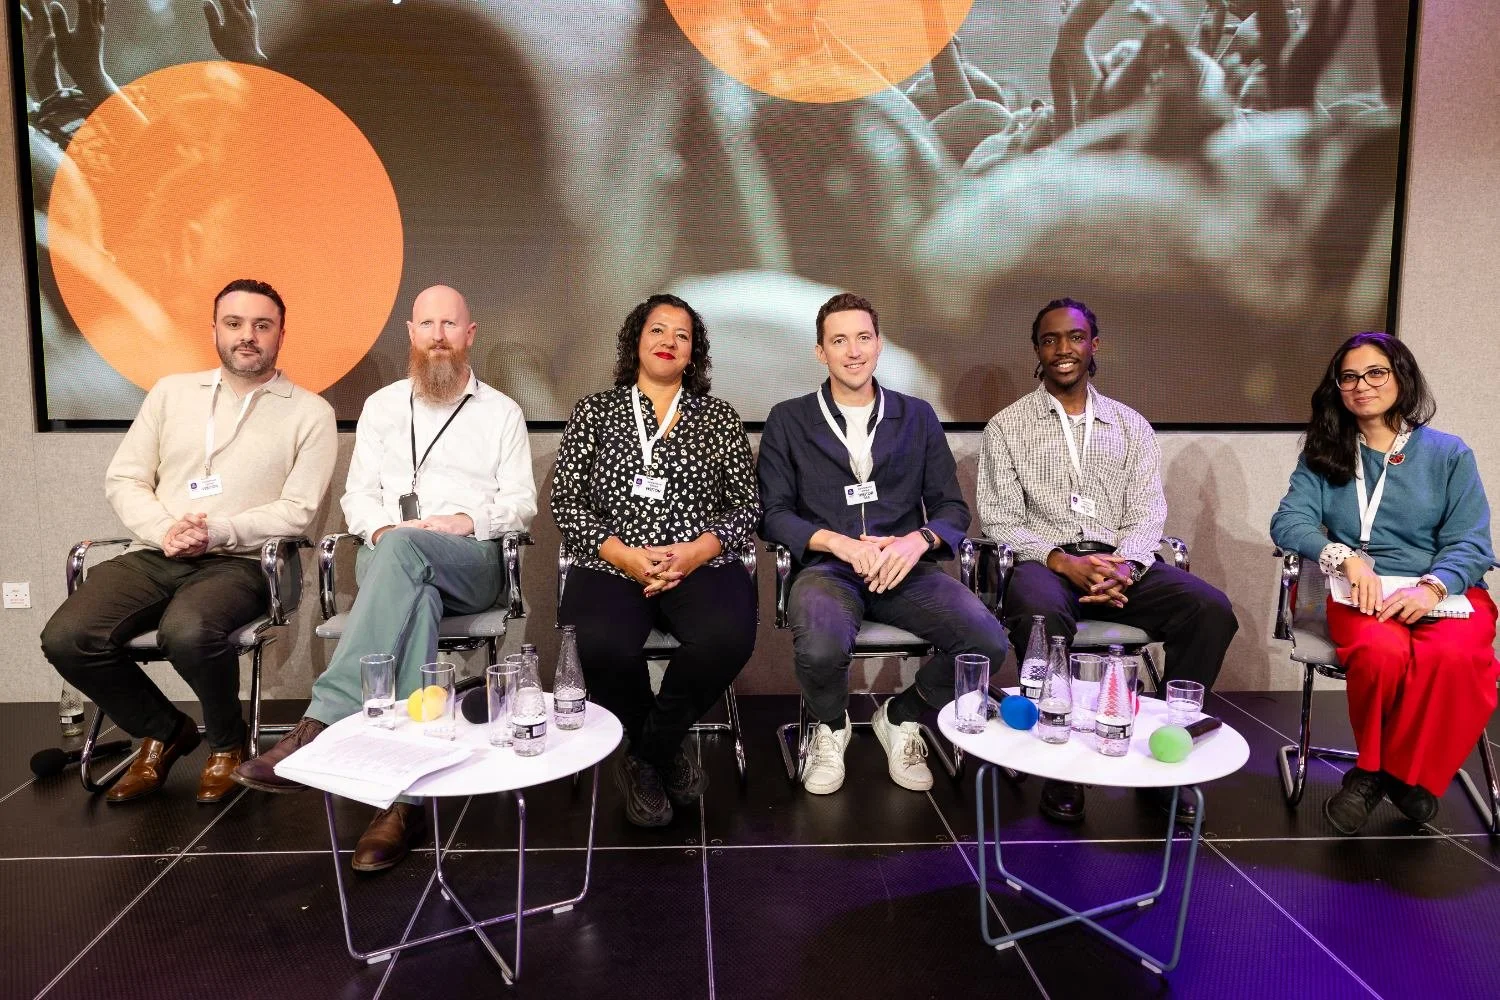
Partnering to Build Better Pathways to Black and Global Majority-Led Change
Funders like City Bridge Foundation, Wellcome Trust, and Esmee Fairbairn Foundation partner with DiNN because reaching Black and Global Majority-led organisations well takes more than money, it takes lived experience, care, and evidence-based design.
-

How We Are Solving the Gaps That Stop Black and Global Majority-Led Organisations from Growing
Black and Global Majority-led organisations aren't short on talent or community trust. What's missing is infrastructure: the funding pathways, investment readiness, and civic support that turn good work into lasting impact. Here's where those gaps are, and how DiNN is built to close them.
-

List of Grantees
From grassroots youth groups to climate initiatives, arts collectives to health-focused CICs, see the full list of Black and Global Majority-led organisations we've supported since 2023, a snapshot of the ecosystem we're helping to build.
Join DiNN Community
DiNN Community is a safe and intentional online platform available to all Black individuals and leaders wanting to access resources, network, and share research and lived experiences.

Get in touch with Ozias for more
information
Want to get more involved, ask a question, or share some ideas? Feel free to get in touch.